
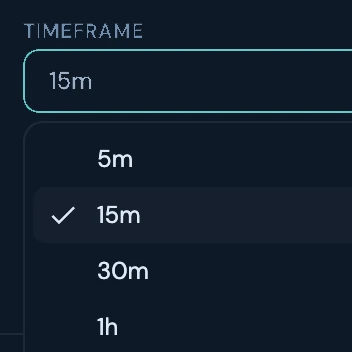
Timeframe
Pick the timeframe that fits how you trade.
Market view
Relative strength across coins. Liquidity across exchanges.
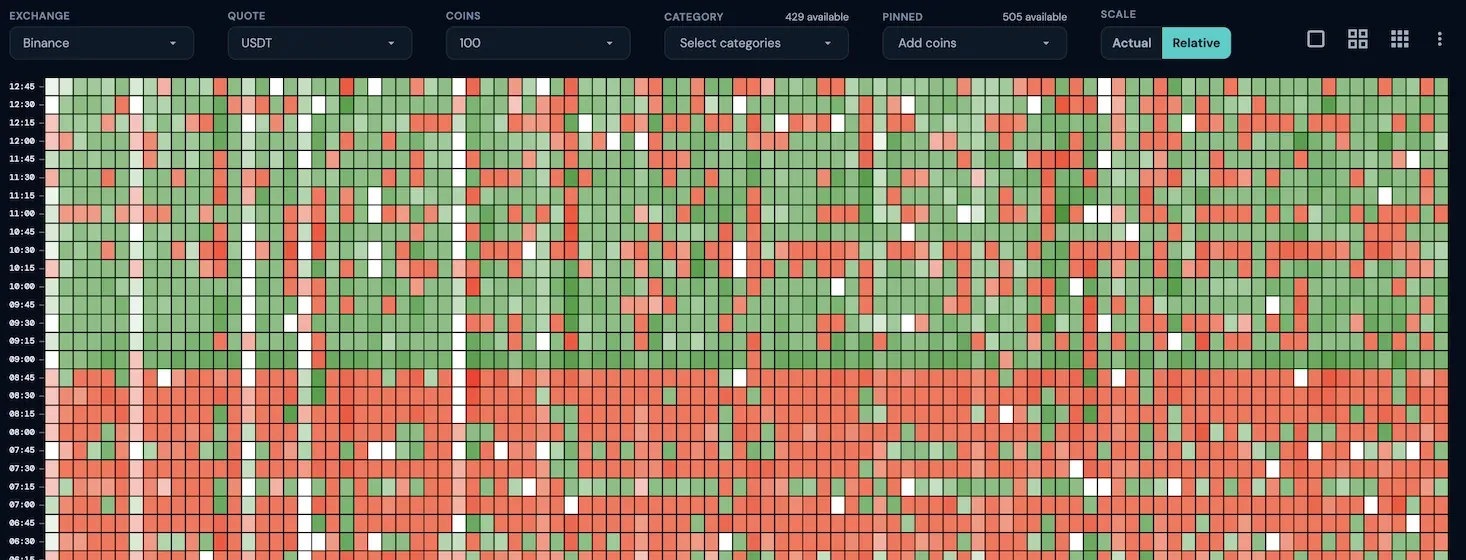
Discover relative strength between coins, on the board you set.

Pick the timeframe that fits how you trade.
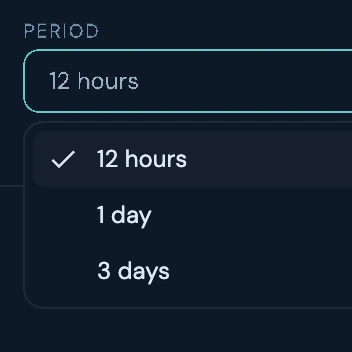
See several days of change in one grid.
Switch between actual and relative change, each with its own color scale.

Find coins that outperformed the rest.
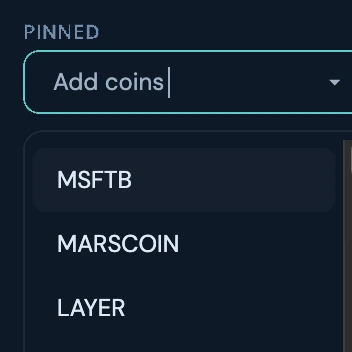
Pin the coins you want to keep in view.
Covers 800+ coins, including the major tokens.
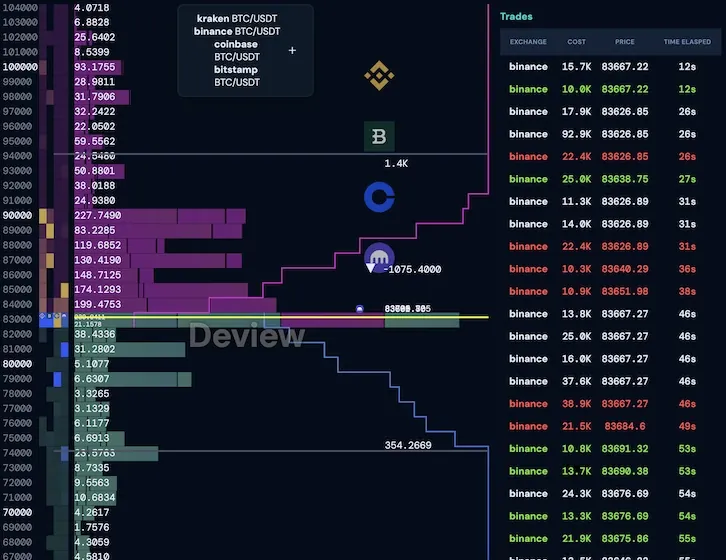
Liquidity at a glance, for support and resistance.
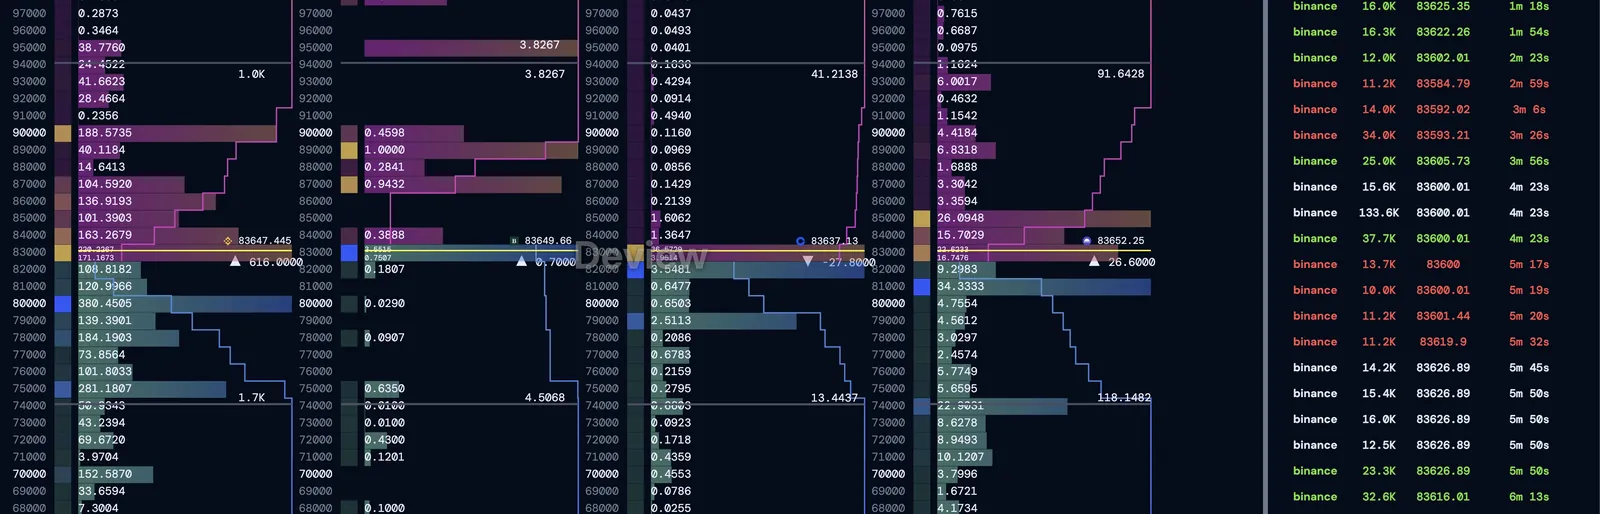
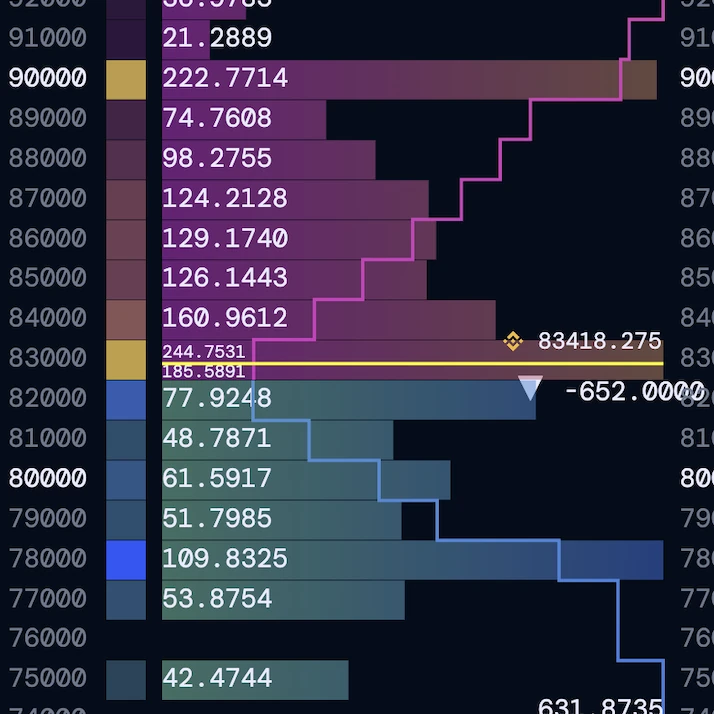
See where large orders cluster, so support and resistance stand out.
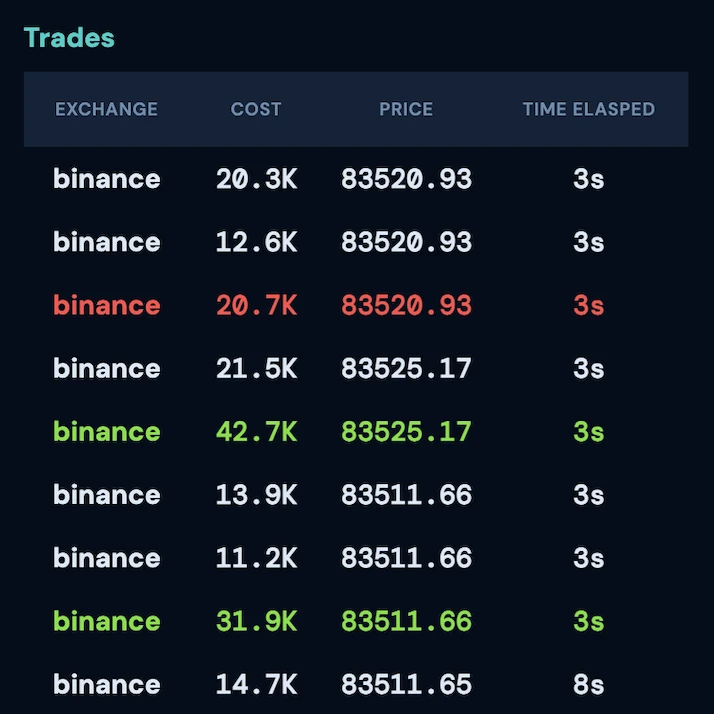
All executed trades, from each exchange, in one list.
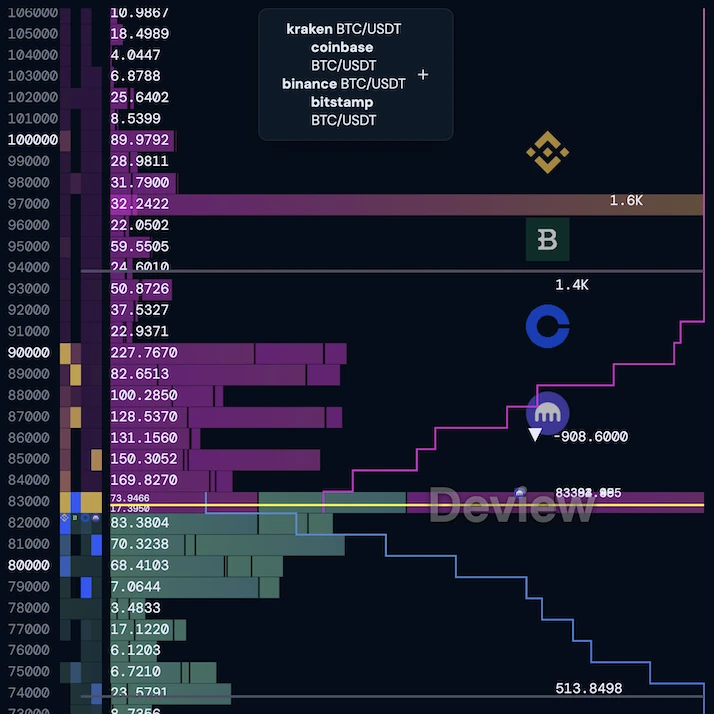
Bids and asks from each selected exchange, added together at every price.
Track order book data from these exchanges in one view.